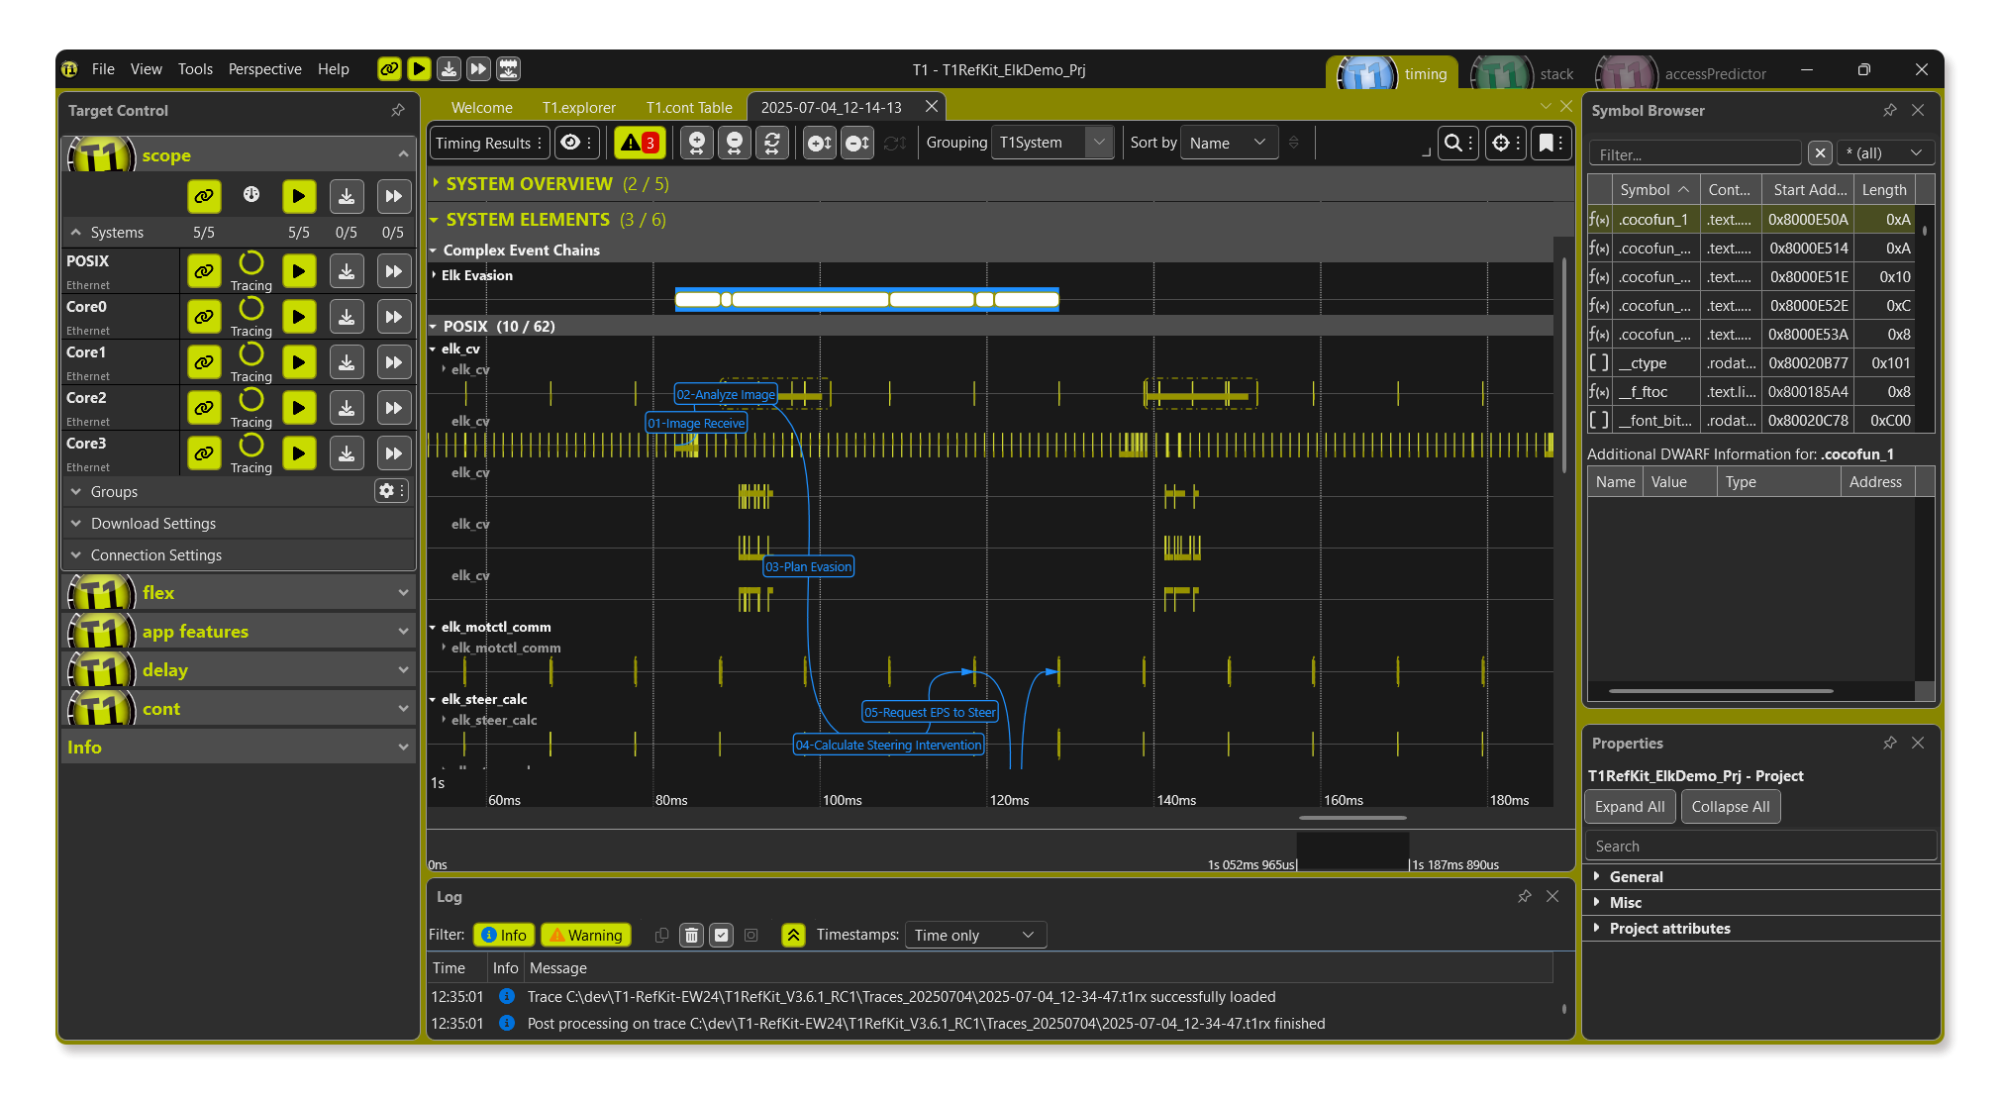
When opening T1 V4.0 for the first time, you will immediately recognize the new look and feel. Pick either the bright or the dark theme and get started with streamlined analyses of the timing, the stack consumption and the memory accesses of your software. You will see: V4.0 offers much more than a new and shiny user interface. We have built the help system around typical use-cases and T1.explorer is a completely new view that takes your analysis work to the next efficiency level.
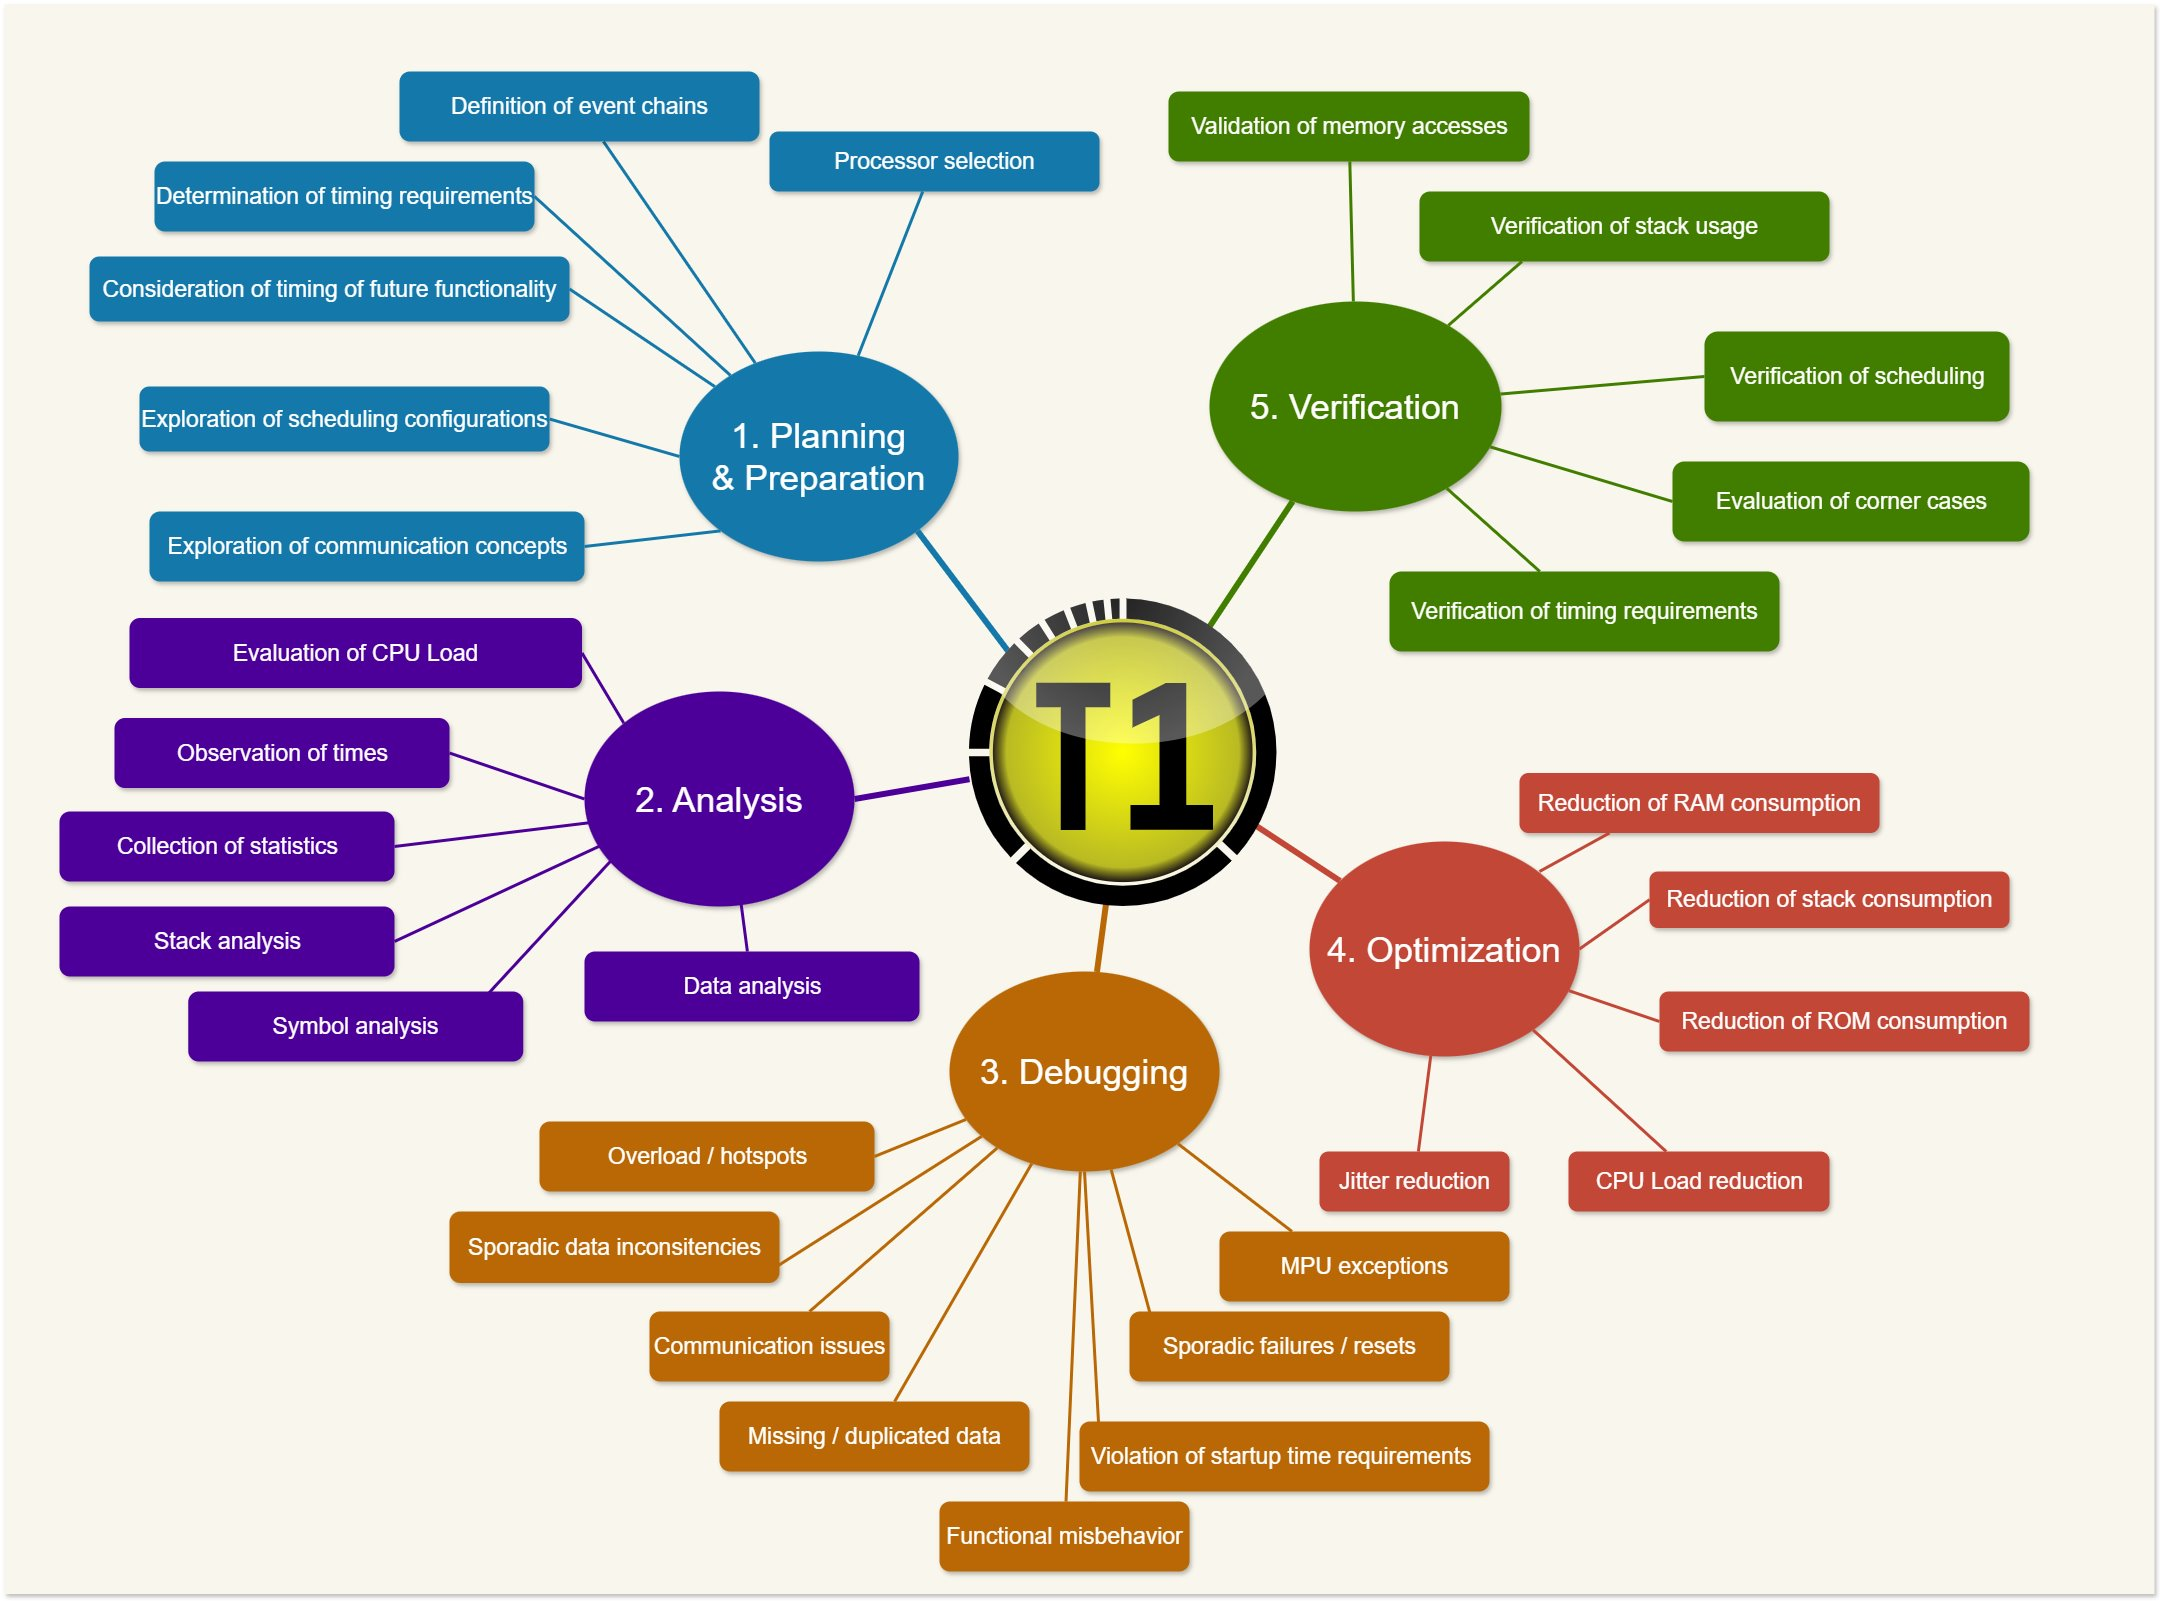
T1 Version 4 is designed to boost your efficiency across every stage of development:
With T1 V4, you gain a smarter, more intuitive analysis suite that empowers your team to deliver better results in less time.
With the full migration to WPF, T1 now delivers a modernized interface with consistent UI concepts across the tool and significantly improved performance. The new architecture ensures smoother workflows and a more responsive user experience. As an added benefit, a dark theme is available, providing enhanced usability and comfort for extended working sessions.
With T1 Version 4, user guidance follows a use‑case driven approach, making workflows more intuitive and efficient. Extended tooltips provide context‑sensitive support right where it’s needed, helping users quickly understand features and accelerate their analysis. This combination ensures faster onboarding and a smoother experience for both new and experienced developers.
T1 delivers value across the entire V‑Cycle — from planning and design through implementation, verification, and production maintenance.
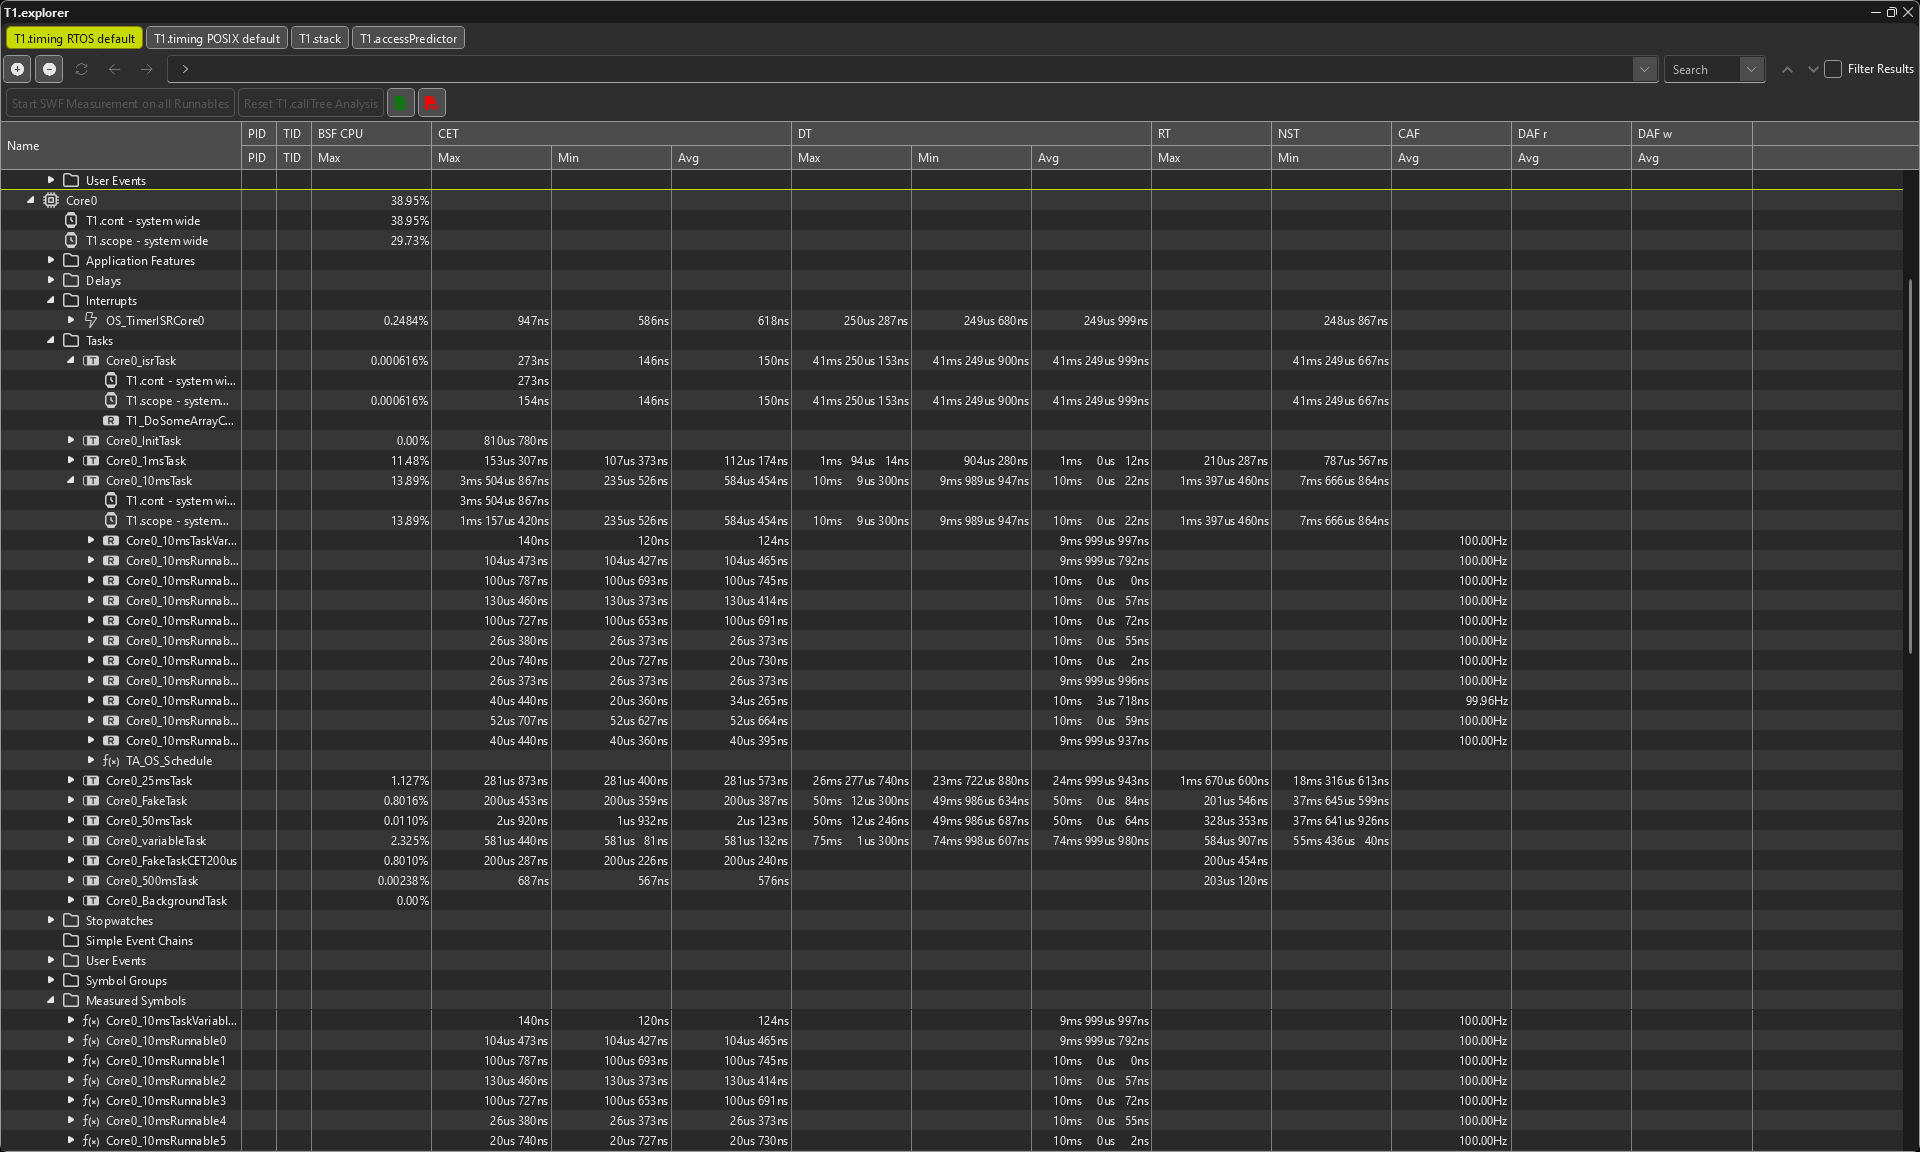
T1.explorer provides a powerful tree‑based visualization of your system, bringing call‑graphs and context information together in a single window. With one central place for analysis, you gain a clear understanding of your software’s structure and can perform context‑specific investigations with ease. This makes complex systems more transparent and accelerates your development workflow.
Example hot-spot analysis: T1.explorer makes hot‑spot analysis effortless — quickly highlight the top ten consumers based on relevant timing metrics and concentrate your optimization on the areas that matter most.
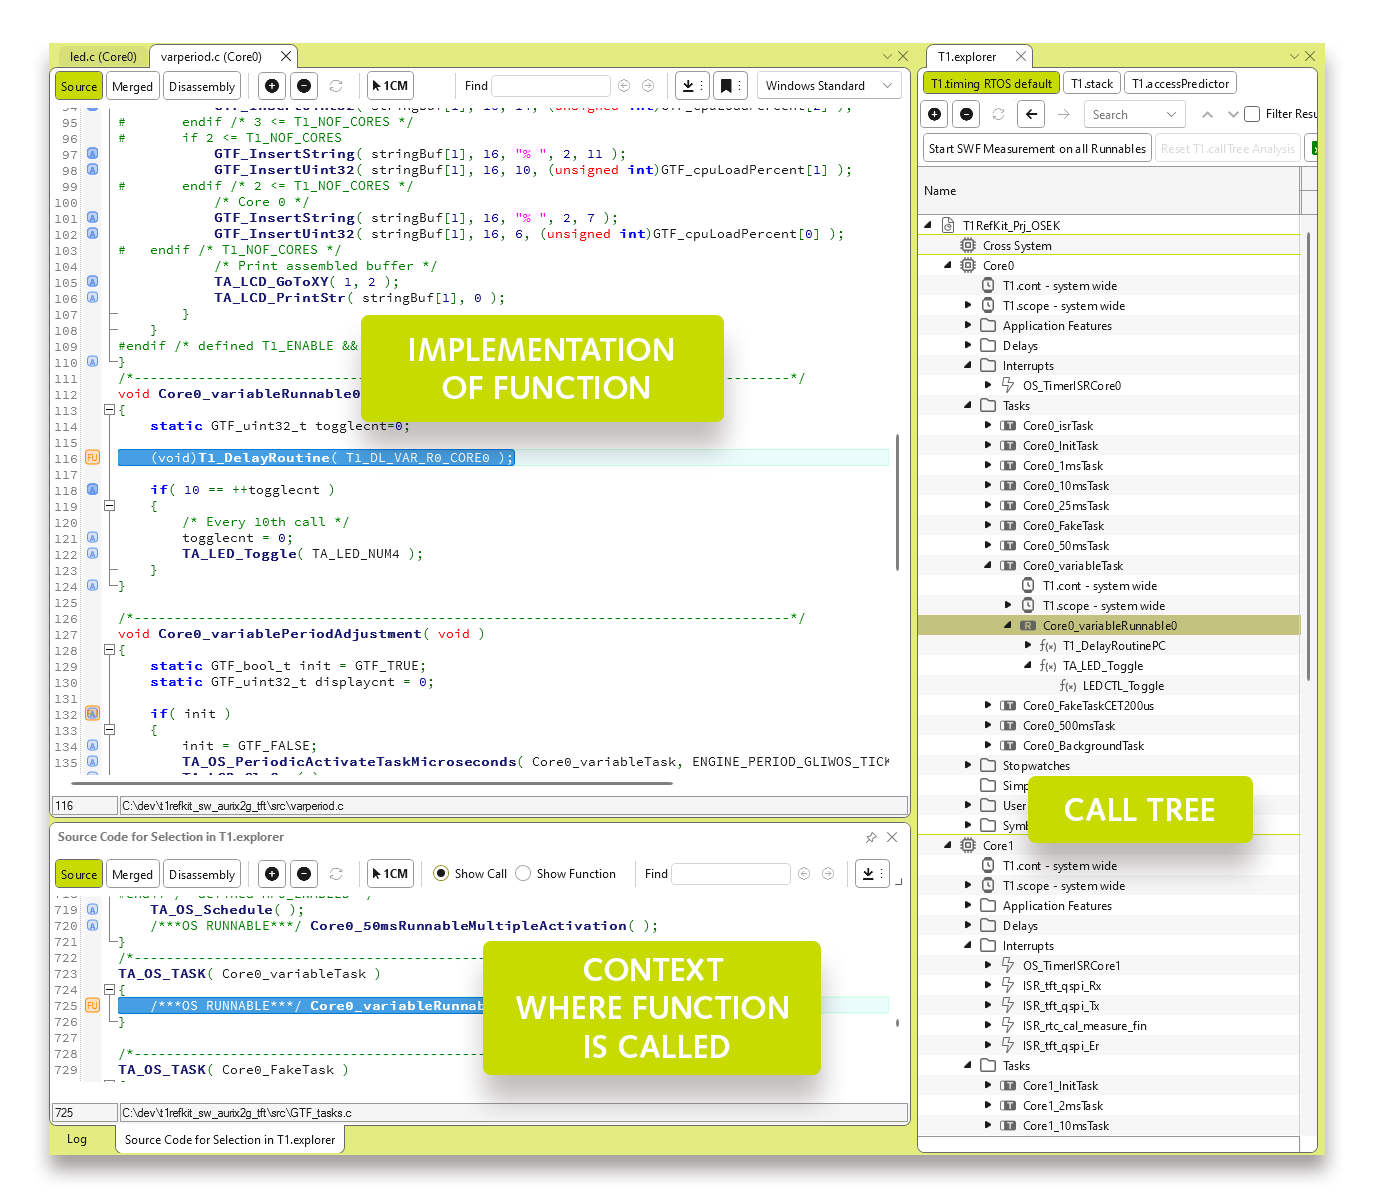
With the integrated call tree analysis you can instantly see which functions call each other, making complex relationships transparent. Selecting a function in the call tree automatically highlights the corresponding call in the source code, giving you direct context and seamless navigation. This tight integration accelerates analysis and helps you understand your software structure at a glance.
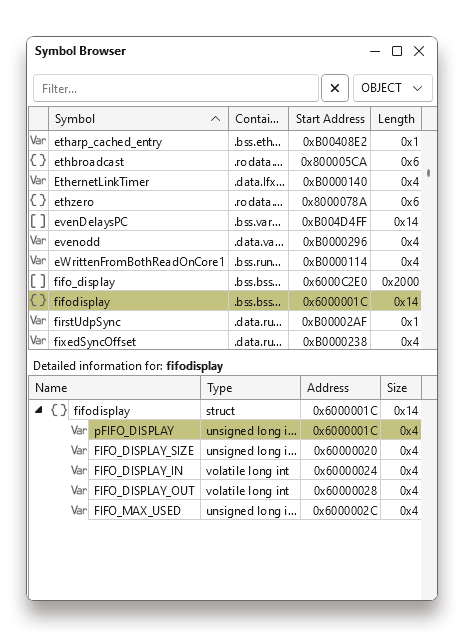
T1 now provides full support for complex C data types — including structs, arrays, unions, and bitfields. This enhancement unlocks deeper insights into your software, enabling more precise analysis and making even the most intricate code structures transparent and easy to evaluate.
Detailed information such as name, type, address, and size gives you the clarity you need. And looking ahead: upcoming releases will also support direct measurement and manipulation of values, further expanding your optimization capabilities.
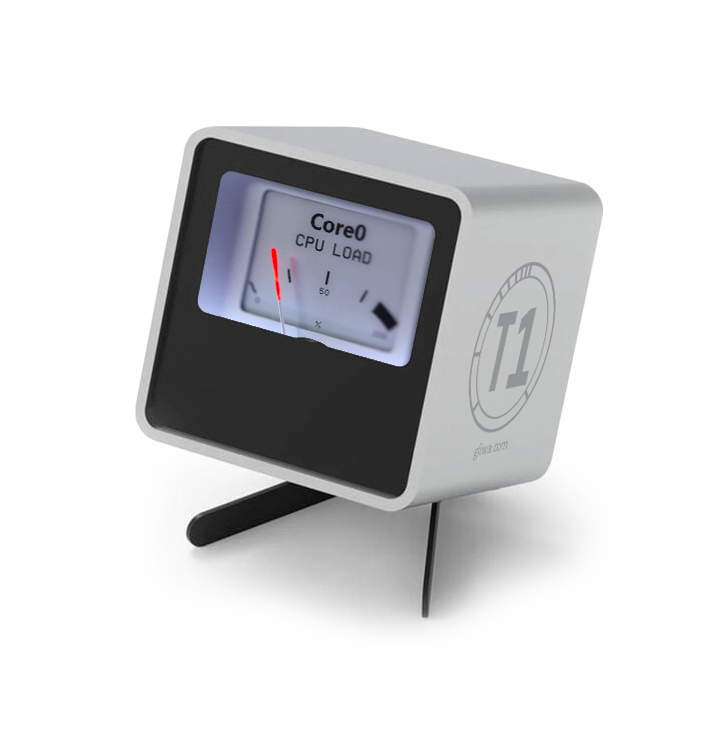
T1 Gadget takes your analysis to “the next level” — because who wouldn’t want a configurable, retro‑style analogue device to visualize CPU load across different cores? Finally, you can watch your processors sweat in style while focusing on what really matters: smarter insights and smoother workflows.
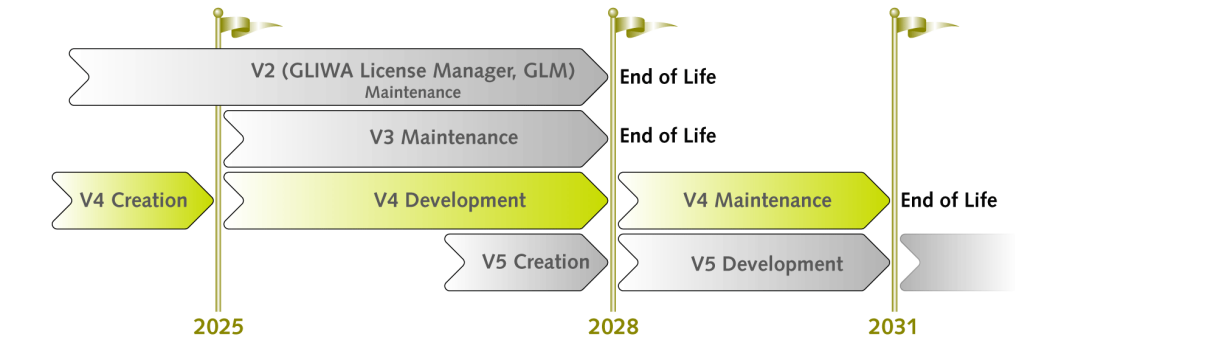
During the development phase, T1 V4 will continuously evolve — enriched with new enhancements delivered in minor releases twice a year.


 Download T1V4.0